
The Impact of Infographics:
Let’s be honest: nobody wakes up excited to read a wall of text. But show them a clean, clever infographic? Now you’ve got their attention—and maybe their coffee hasn’t even kicked in yet.
Infographics sit at the sweet spot where data meets design. They turn complex ideas into visual stories that are easier to understand, faster to absorb, and far more likely to be remembered. In a world where attention spans are measured in scrolls, infographics don’t just help content survive—they help it thrive. I have been working on.
Why Infographics Work So Well
1. The brain loves visuals
Humans process visuals significantly faster than text. Charts, icons, and illustrations reduce cognitive load, meaning people “get it” quicker—and with less effort. Translation: less thinking, more nodding.
2. They simplify the complicated
Dense reports, technical processes, statistics-heavy topics—these are infographic goldmines. A well-designed graphic can turn intimidating information into something intuitive and even enjoyable.
3. They boost retention
People remember visuals far longer than text alone. When information is paired with imagery, recall improves dramatically. That’s why infographics are especially powerful for education, onboarding, and thought leadership.

Infographics in Marketing: More Than Just Pretty Pictures
Infographics aren’t decoration—they’re strategic tools.
Higher engagement: Visual content consistently outperforms text-only posts on social platforms.
Better shareability: People love sharing content that makes them look smart without making them work too hard.
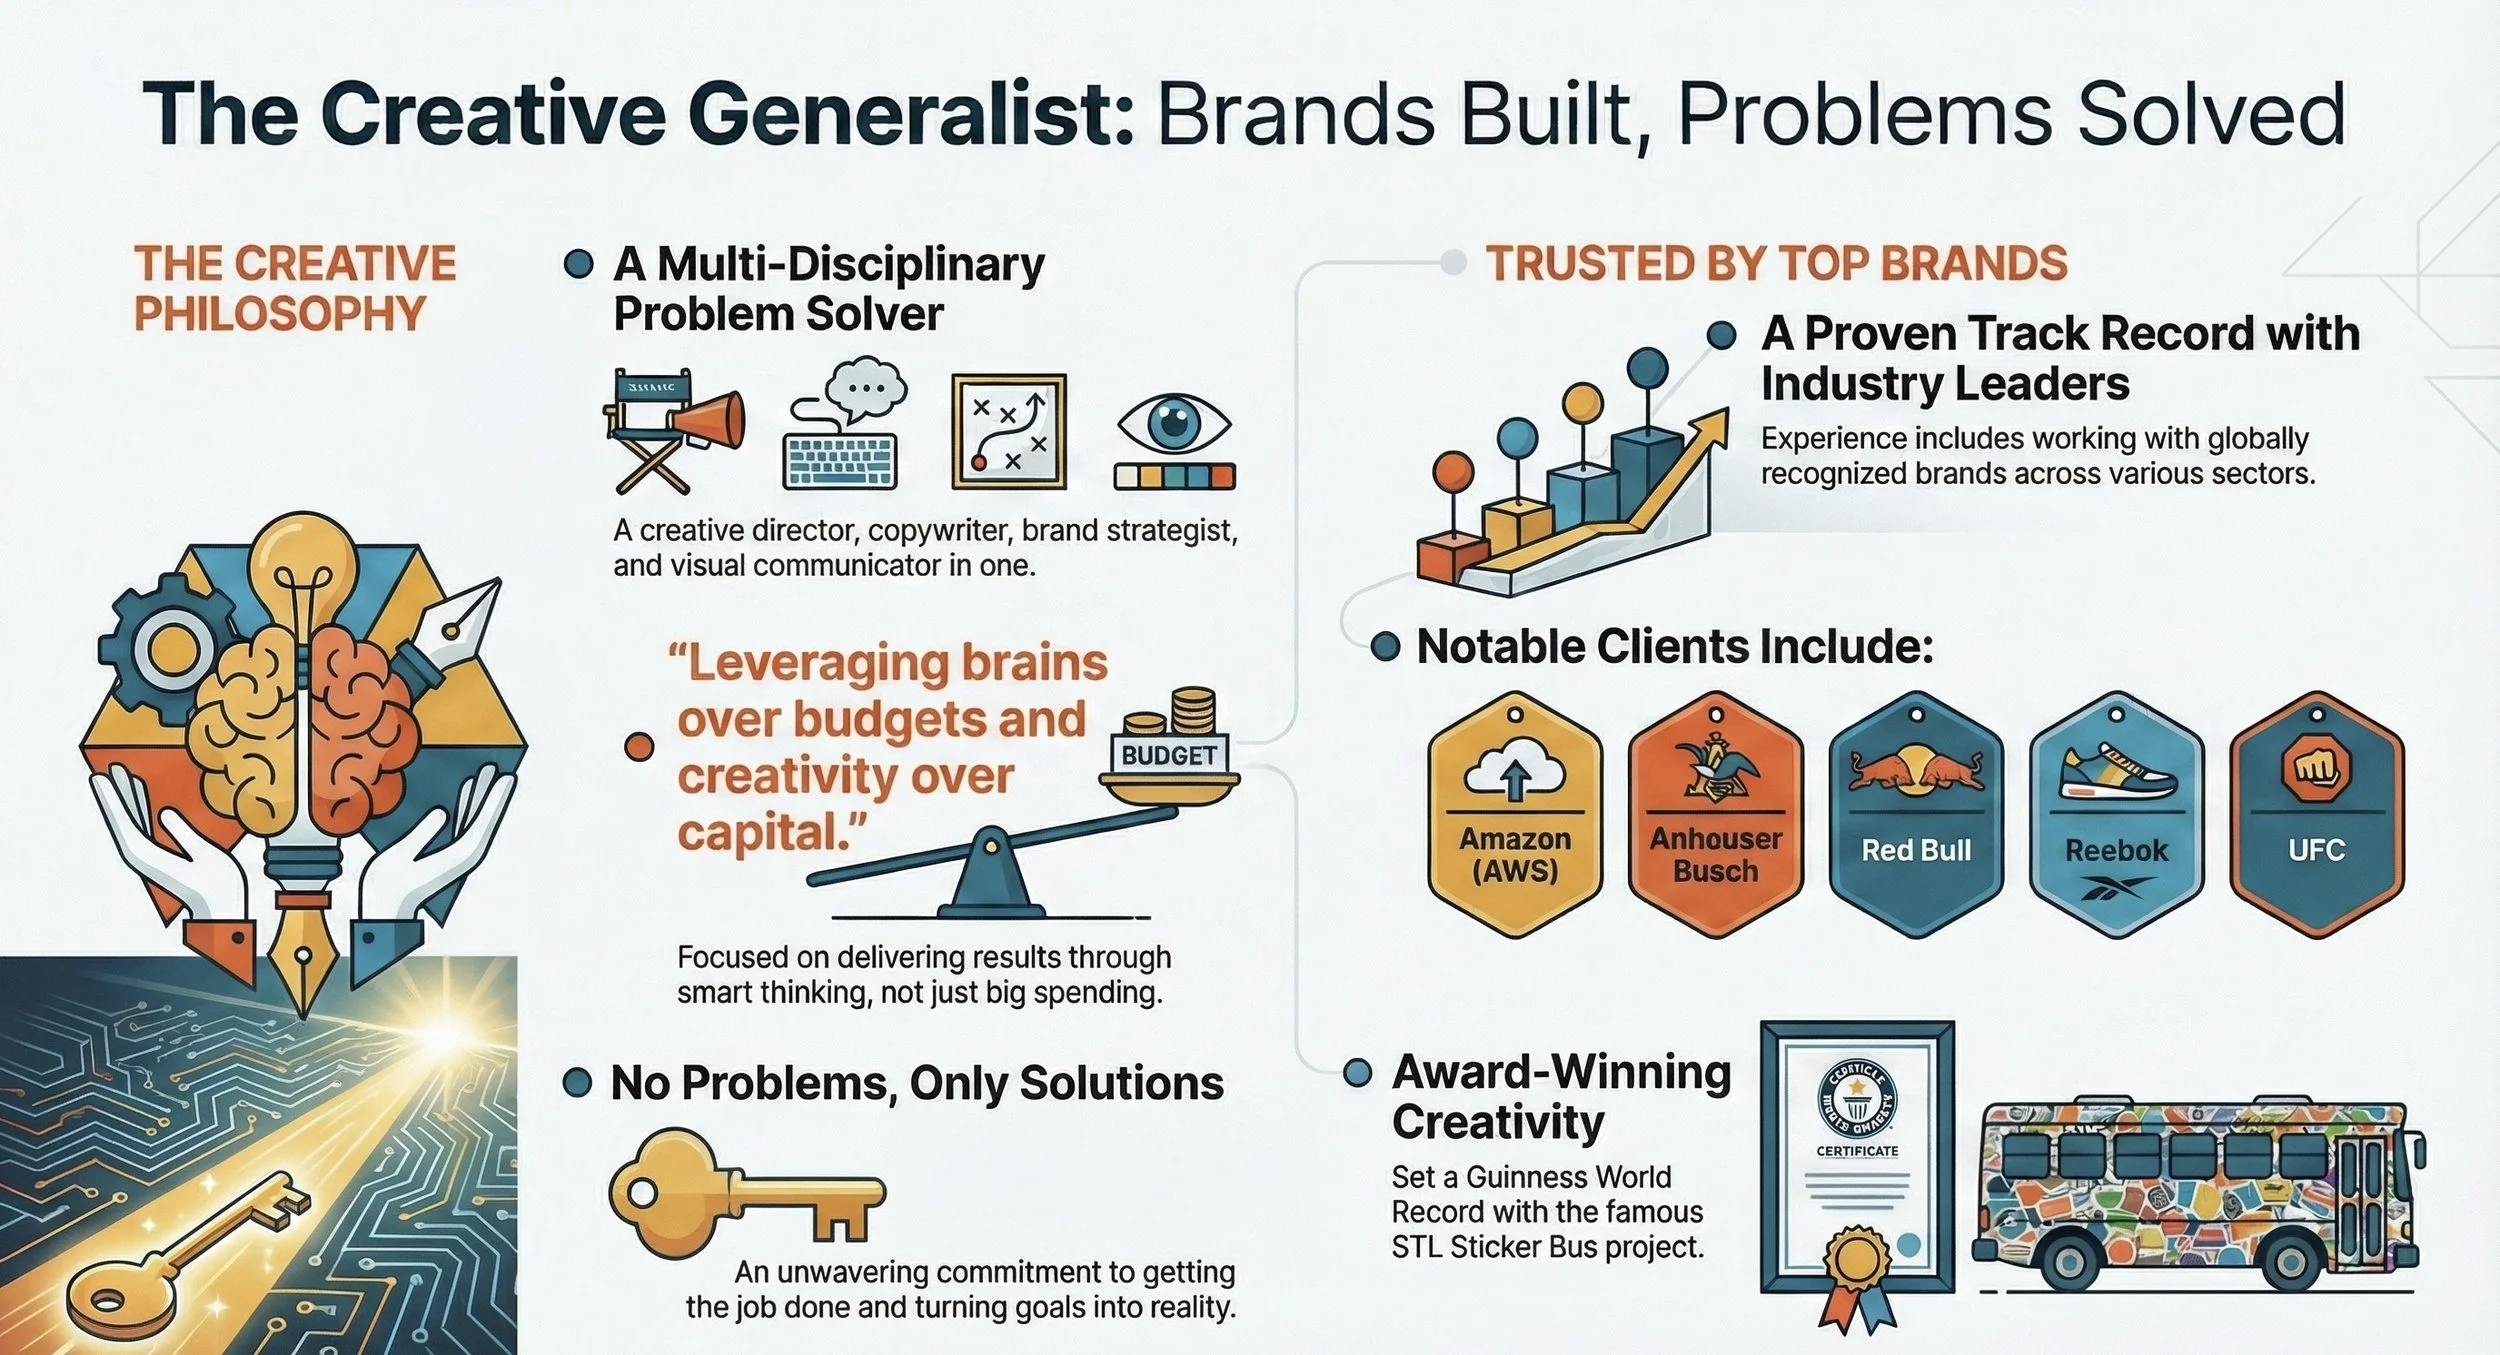
Stronger brand recall: Consistent colors, typography, and visual language reinforce brand identity every time an infographic is seen.
In short: infographics do the heavy lifting while your audience does the light scrolling.
Where Infographics Shine the Most
Blog posts: Break up long-form content and summarize key takeaways.
Social media: Perfect for quick hits of value that stop the scroll.
Sales & presentations: Explain benefits, workflows, or comparisons at a glance.
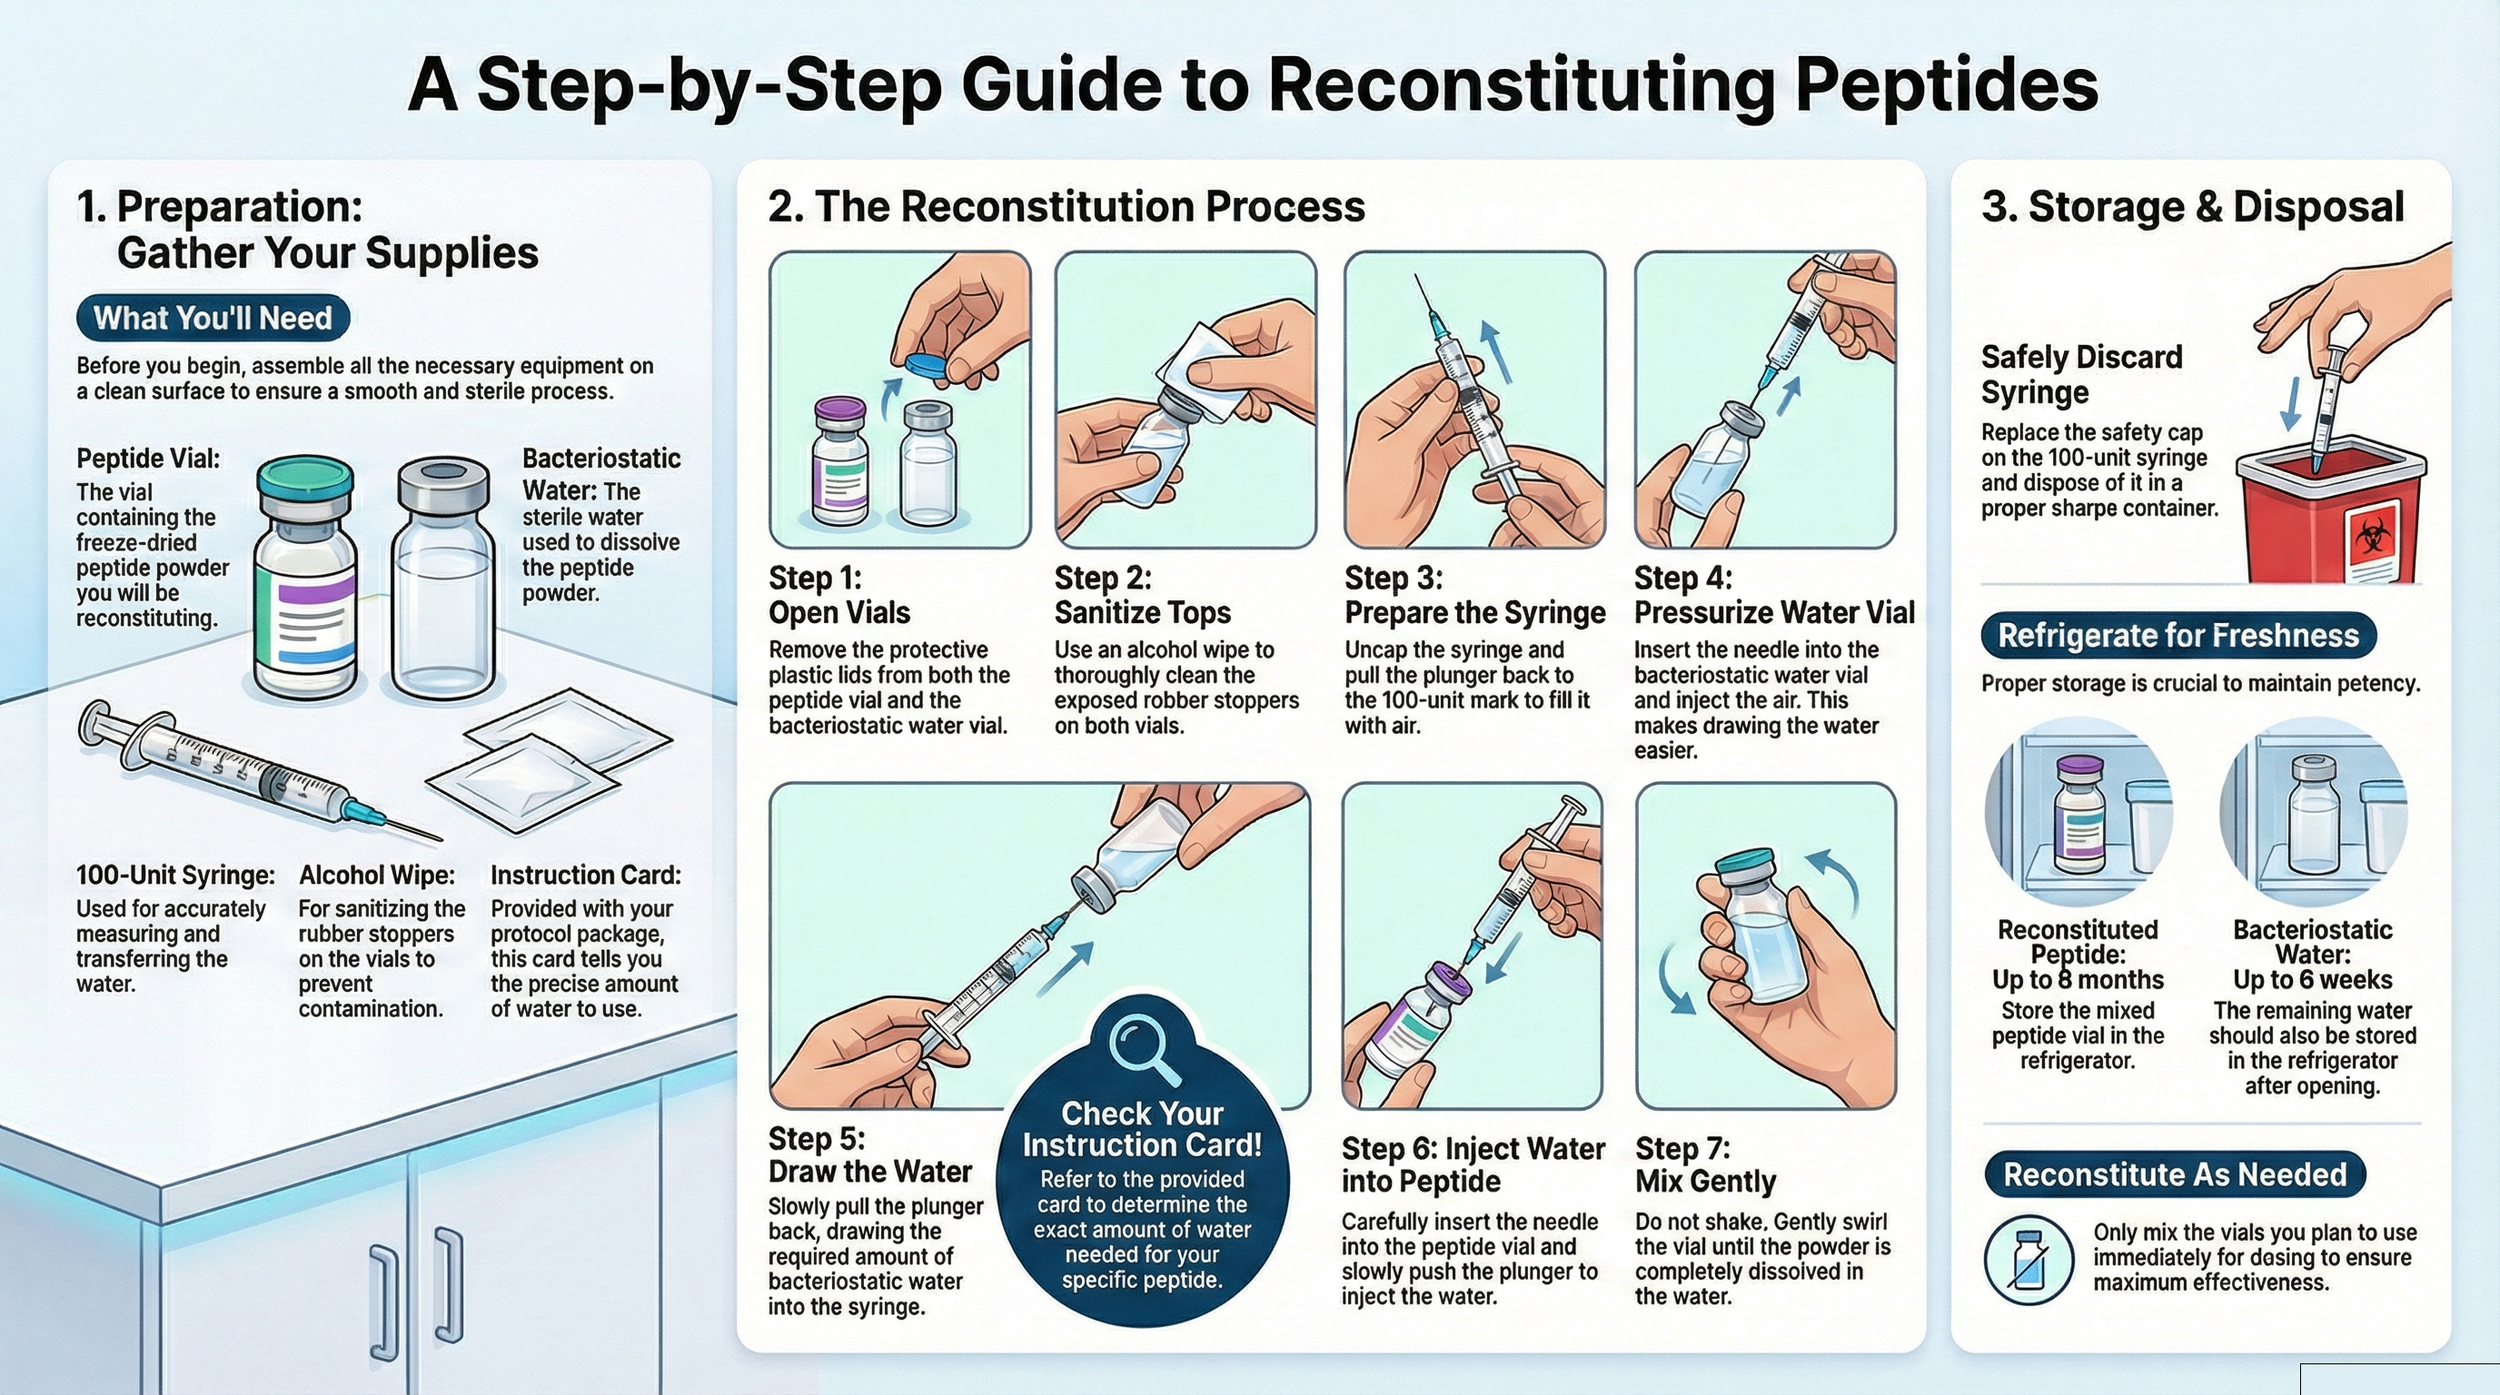
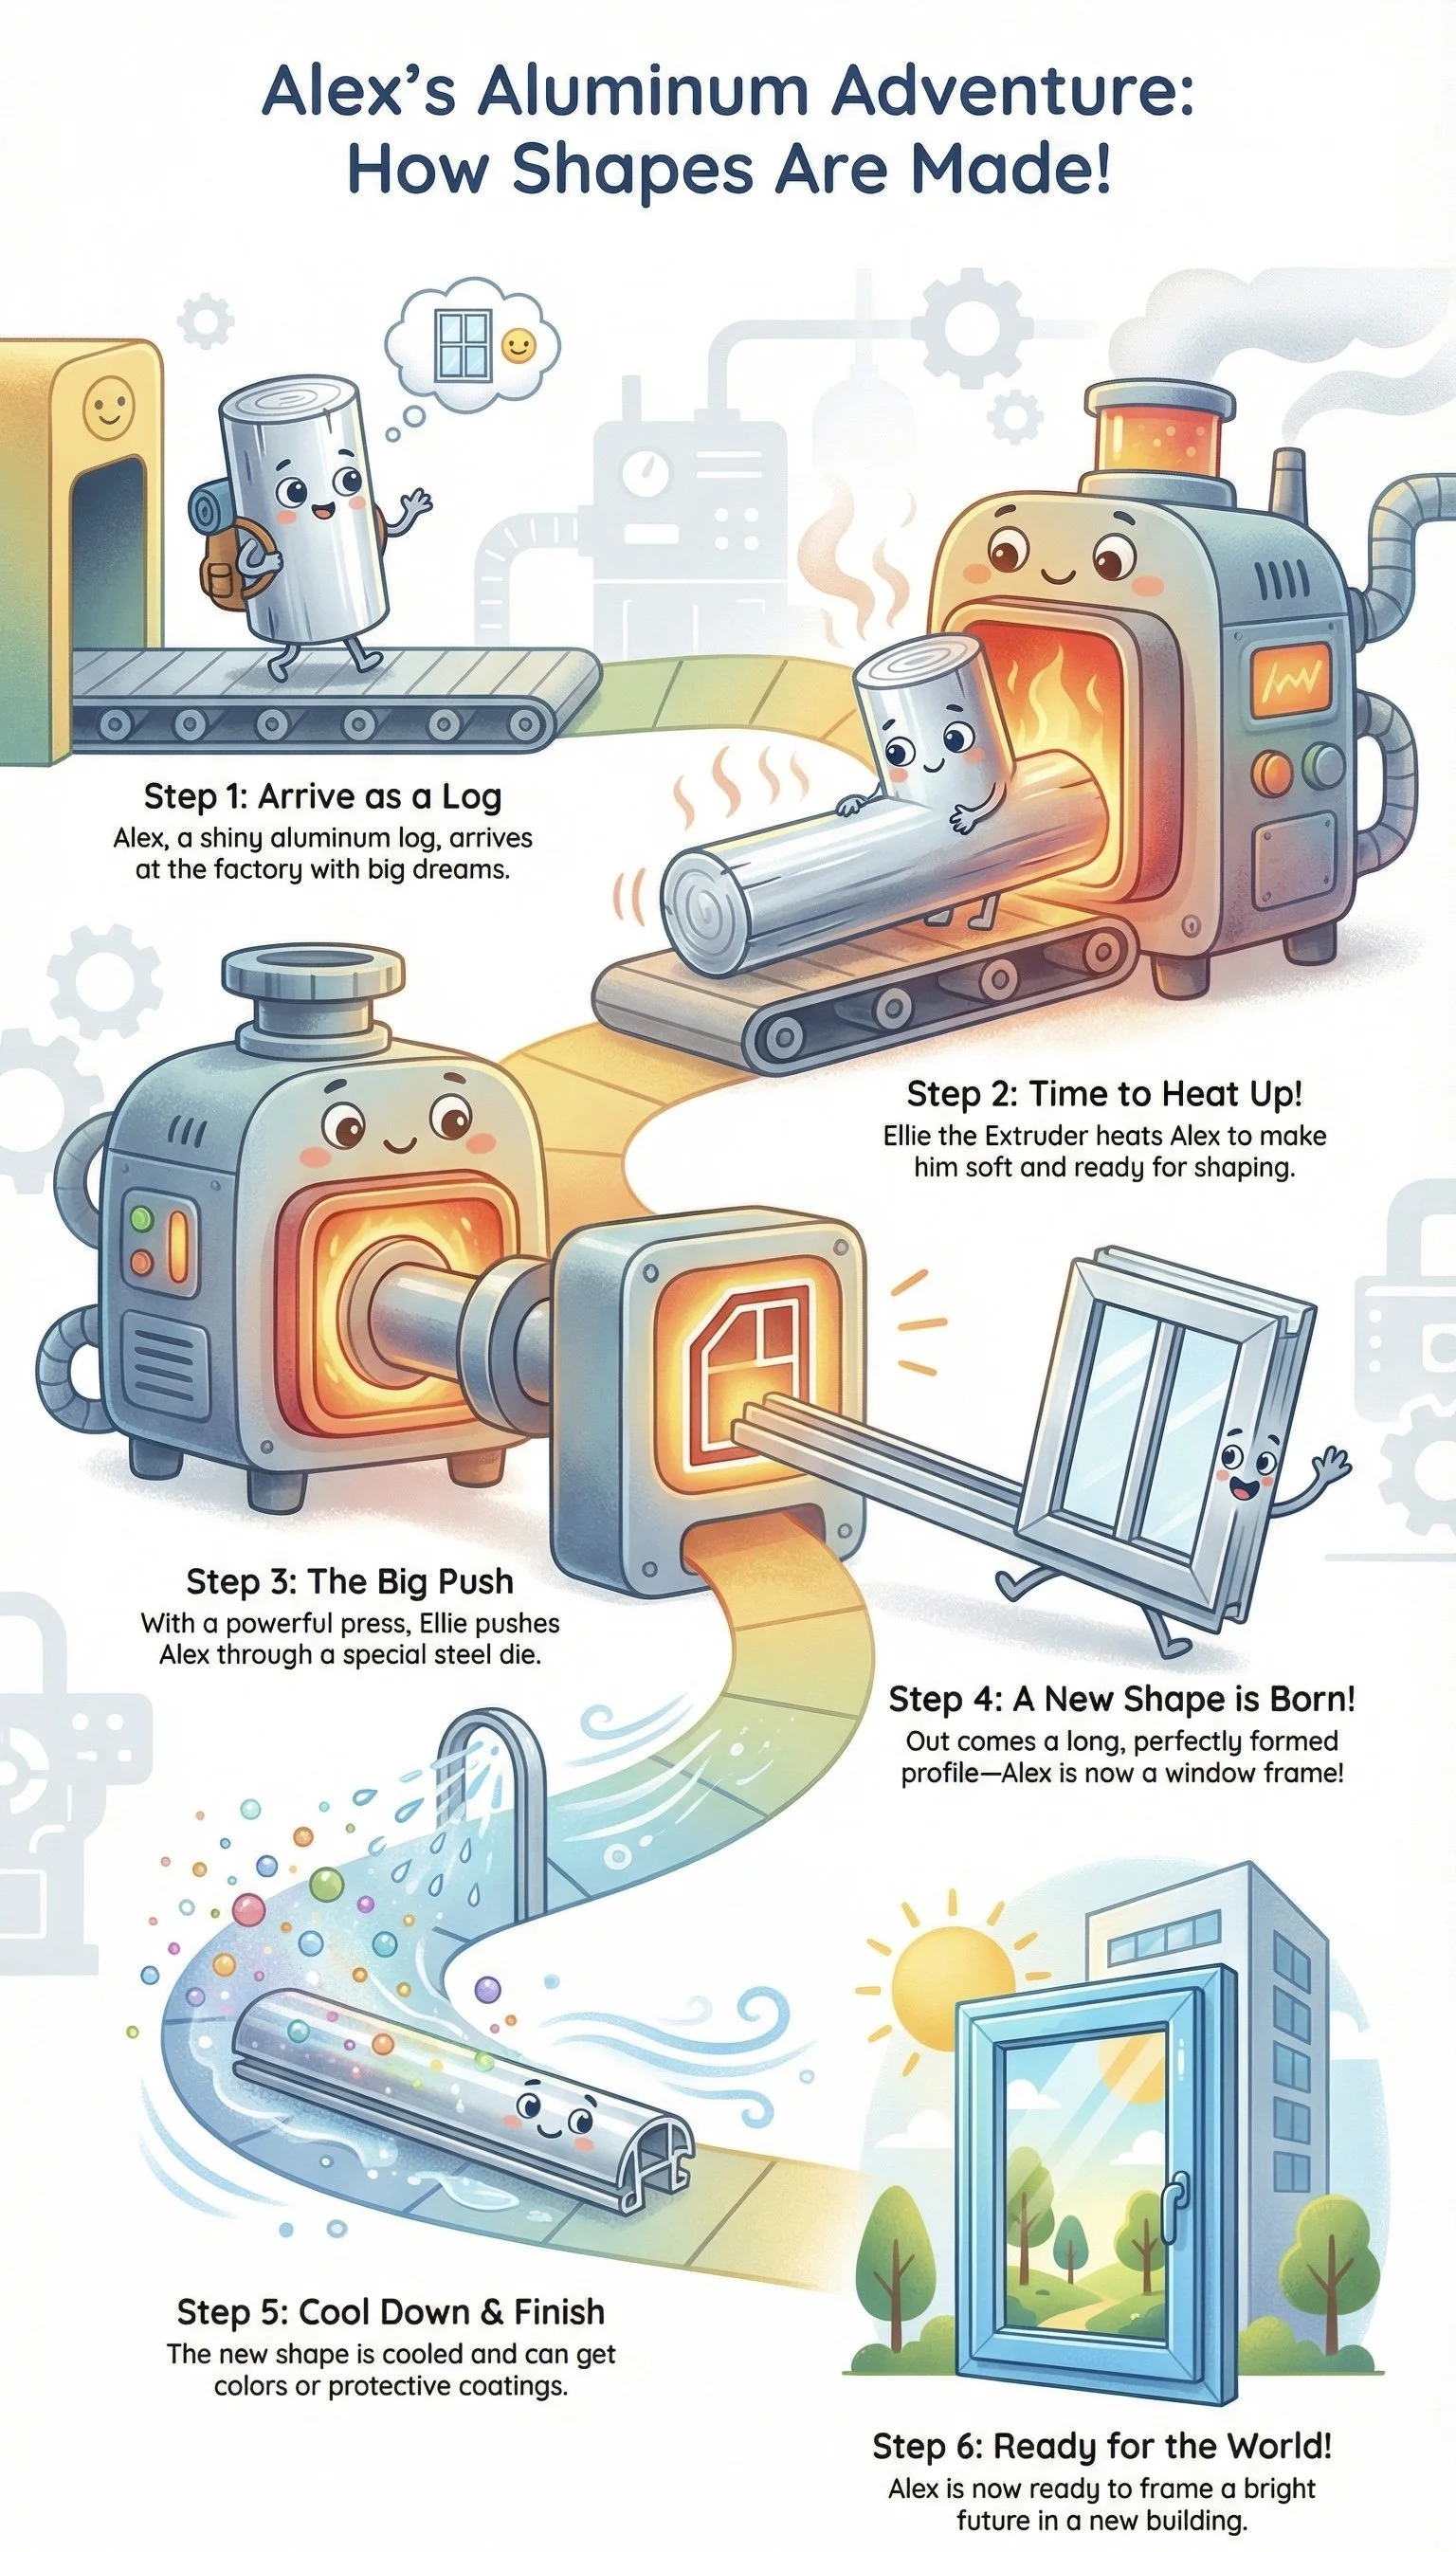
Education & training: Ideal for step-by-step processes and visual learners.
Reports & whitepapers: Turn “skim-only” documents into actually-read ones.